Attack Analysis
This article describes how you can analyze attacks detected by the Wallarm node and take actions regarding them.
The attacks detected by the Wallarm platform are displayed in the Attacks section of Wallarm Console (US Cloud or EU Cloud). The section groups malicious requests into attacks, summarizes them with statistics, and lets you open any attack to inspect its individual requests and respond to them.
In Wallarm:
-
Attack is a group of malicious requests that share the grouping attributes you selected
-
Request is a malicious request plus metadata added by the node
-
Malicious payload is a part of the request with an attack sign
Read details here.
Attacks page
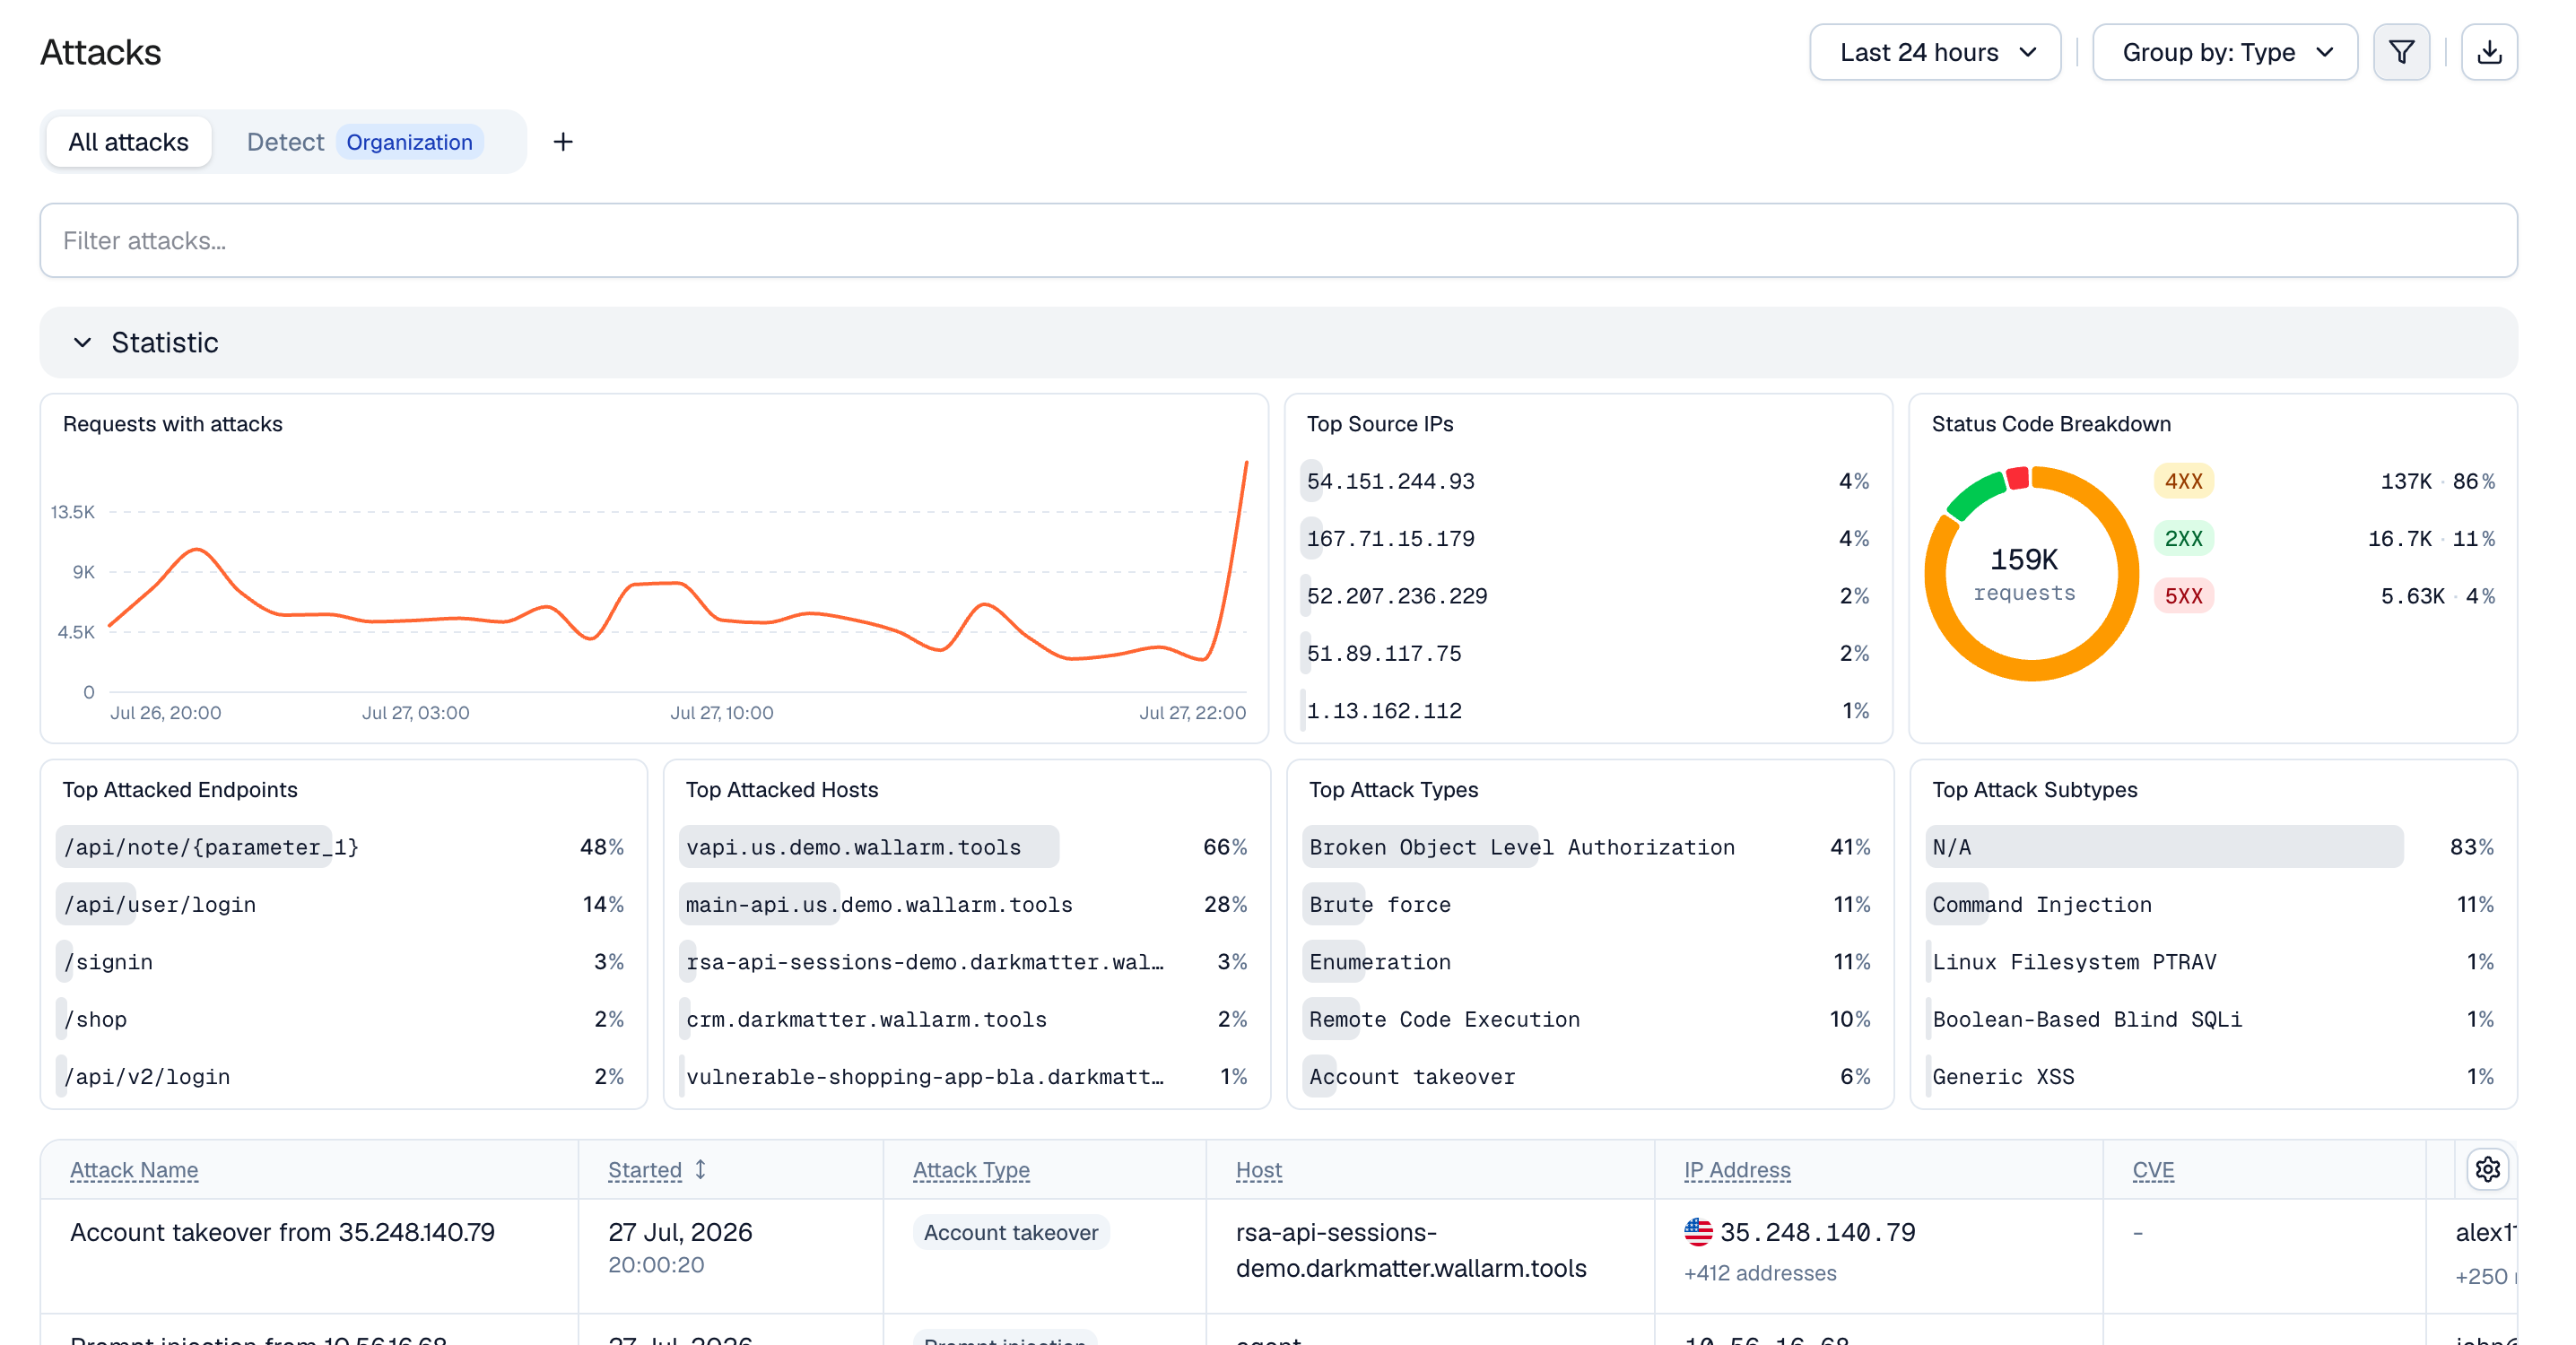
The page presents attacks for the selected period and lets you shape what you see:
-
Views are tabs above the filter. Each view stores a filter, a grouping, a time range, and a column layout, so you can switch between saved perspectives on your attack data in one click. See Attack Search and Filters.
-
The time range selector limits the data to a period of up to 6 months.
-
Group by controls how requests are combined into attacks: by attack type (the default), by source IP, not at all, or by a custom combination of up to 4 attributes. See Attack Search and Filters.
-
The filter field narrows the list down to the attacks you are interested in. See Attack Search and Filters.
-
Statistic is a collapsible panel with charts summarizing the filtered data: requests with attacks over time, top source IPs, status code breakdown, top attacked endpoints and hosts, top attack types and subtypes. Clicking an element of a chart drills into the corresponding attacks.
The table below the panel lists the attacks themselves. Use Table settings to choose, reorder, resize, and pin columns; the column set is stored in the view. To get the data outside of Wallarm Console, use Export attacks as CSV.
Attack details
Clicking an attack opens a resizable drawer with the attack details. The drawer stays open while you click through the table, so you can compare attacks without losing your place.
Overview
The Overview tab summarizes the attack: its status, type, when it was first and last seen, the sessions, users, and source IPs involved, a timeline of its requests, and the distribution of its top hosts and response status codes.
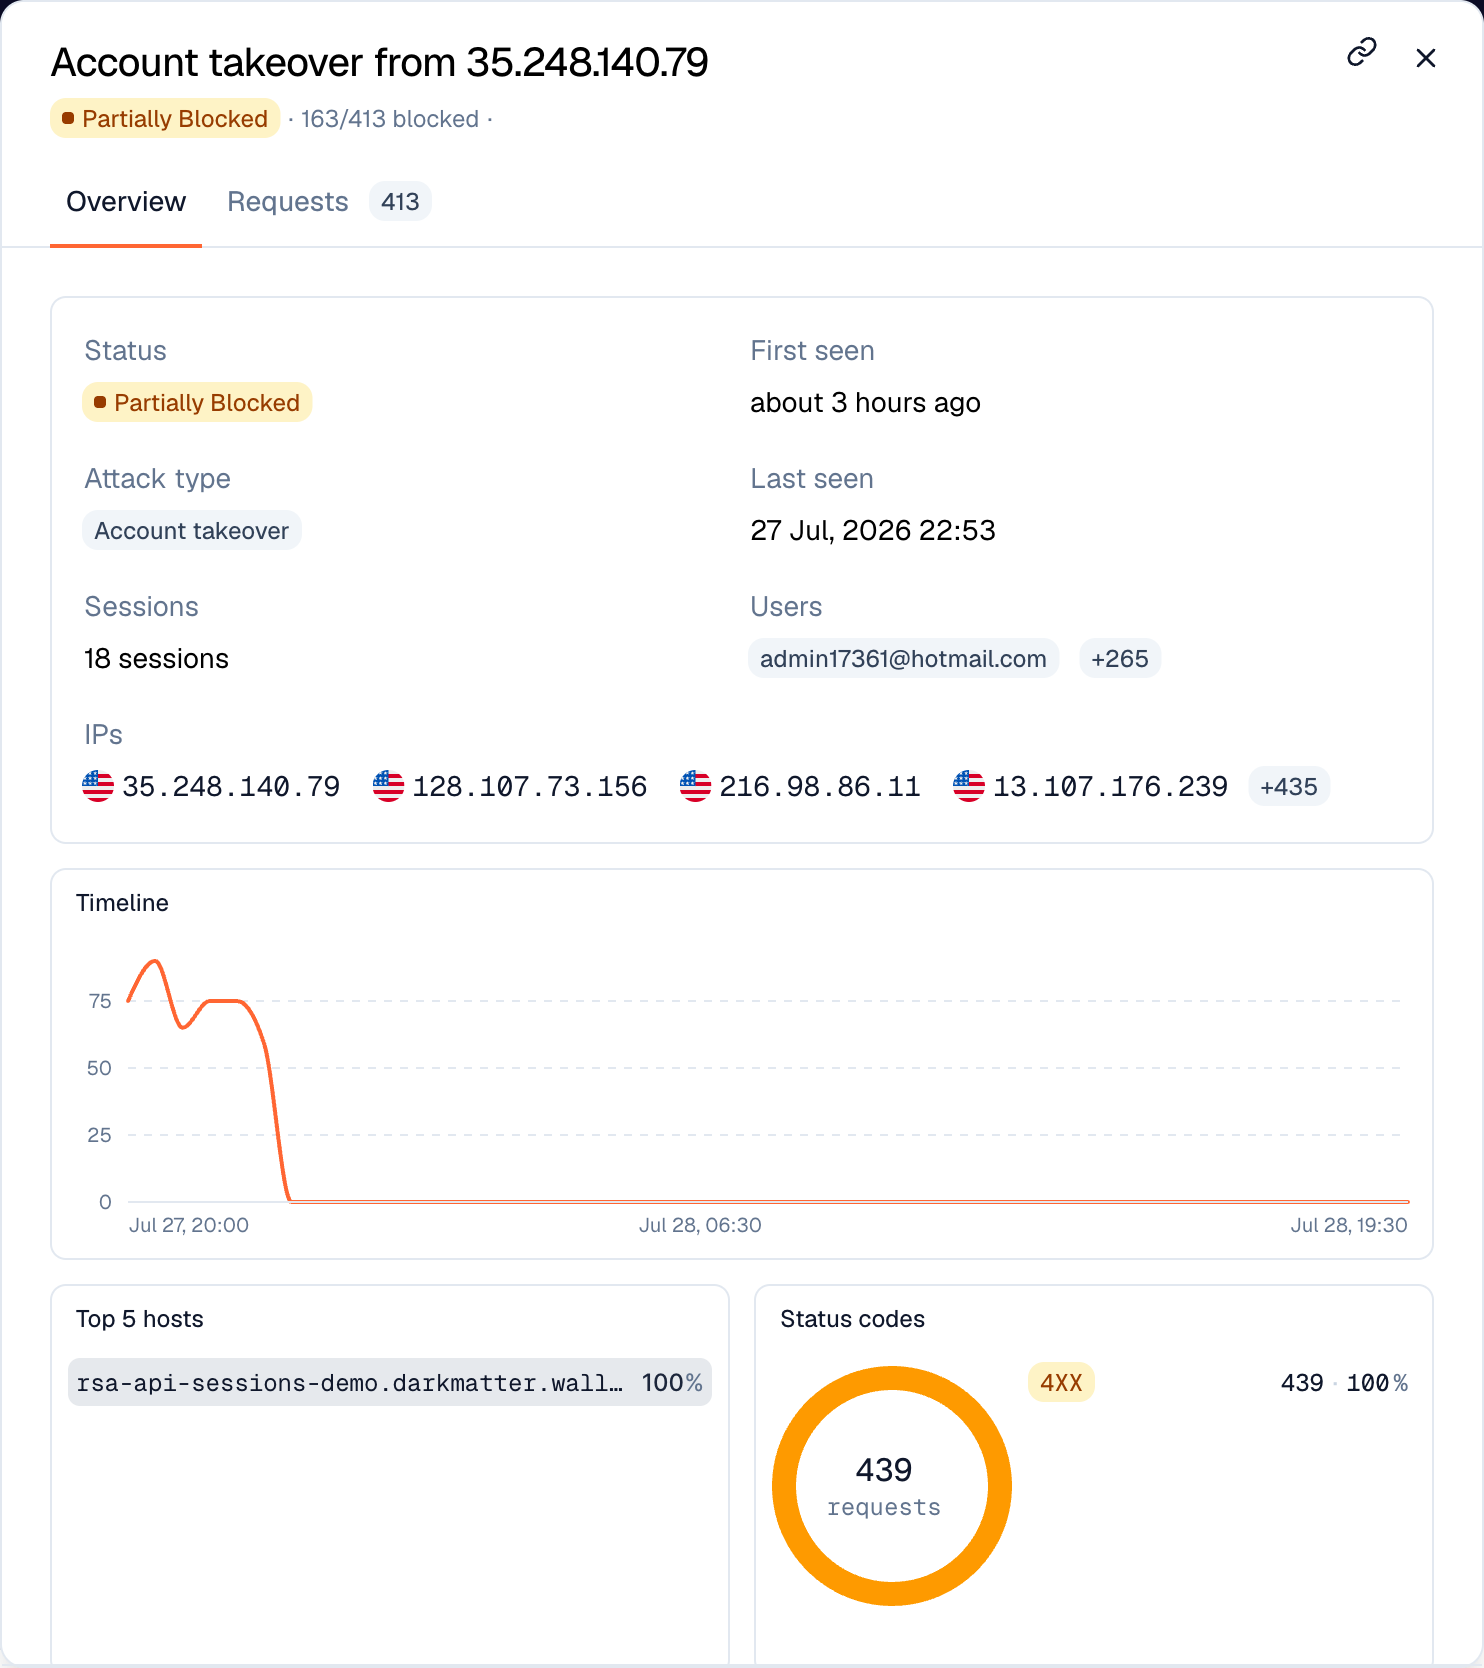
The Status field shows what the node did with the attack:
-
Blocked - all requests of the attack were blocked by the filtering node.
-
Partially Blocked - some requests of the attack were blocked and others were only registered.
-
Monitoring - all requests of the attack were registered but not blocked.
Requests
The Requests tab lists the individual malicious requests of the attack and shows the details of the selected one.
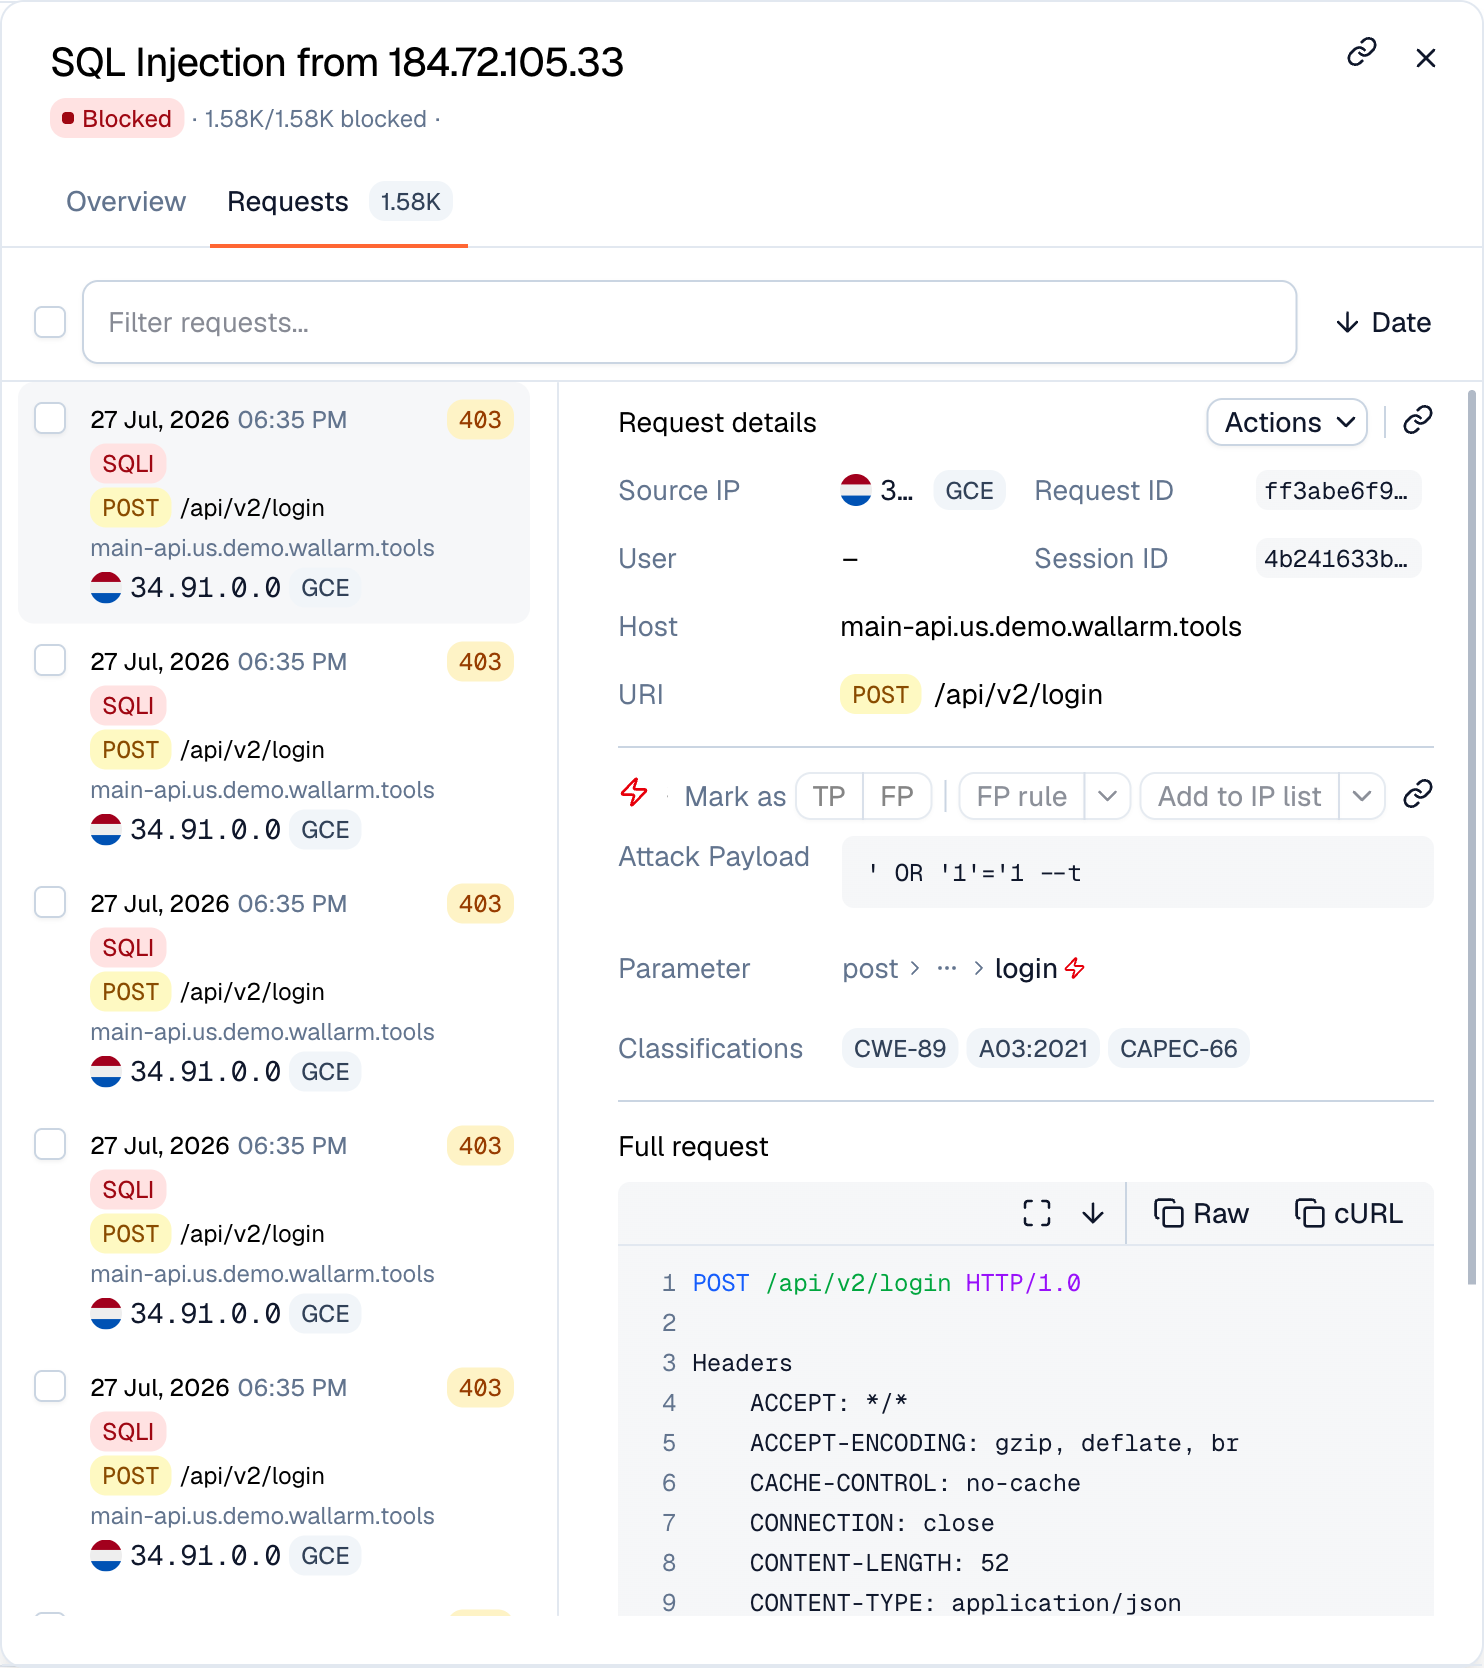
Request details include the source IP, user, host, URI, request and session identifiers, and, for each detected attack sign, the malicious payload, the request point it was found in, and the CWE, OWASP, and CAPEC classifications. Full request shows the complete HTTP request, which you can copy as raw HTTP or as a cURL command.
Only unique requests are stored in the attack details. Repeated malicious requests are dropped from uploading to the Wallarm Cloud and not displayed. This process is called hit sampling. Hit sampling does not affect the quality of attack detection and Wallarm node continues to protect your applications and APIs even with hit sampling enabled.
Use the checkboxes to select several requests and apply an action to all of them at once. The filter field above the list narrows the requests down within the open attack.
Responding to attacks
It is important to understand if your applications and APIs are properly protected from the attacks to have the possibility to adjust the protection measures if necessary. You can use information from the Attacks section to get this understanding and respond correspondingly.
Each detected attack sign in the request details carries an action bar with the measures available for it. Wallarm decides which actions apply to the attack and shows only those:
| Action | Purpose |
|---|---|
| Mark as → TP / FP | Confirm the detection as a true positive, or mark it as a false positive. |
| FP rule | Create a rule that skips this attack sign detection in similar requests. |
| Add to IP list | Add the source IP to the denylist or allowlist. |
| Open Mitigation control | Open the mitigation control that reacted to the request and adjust it. |
| View API Abuse profile | Open the API Abuse Prevention profile that detected the bot. |
| API Abuse exception list | Add the source IP to the API Abuse Prevention exception list. |
| Open Spec Enforcement Policy | Open the violated API specification and adjust its settings. |
To respond to an attack, identify what type of attack took place, understand which Wallarm mechanism reacted to it, and adjust that mechanism if necessary. The table below maps attack types to the mechanism behind them and to the place where you tune it.
| Attack type | Detected by | Where to adjust |
|---|---|---|
| SQL Injection, Cross-site Scripting, Remote Code Execution, Path traversal, CRLF Injection, NoSQL Injection and other input validation attacks | Standard detectors | Rules and the filtration mode of the application, host, or endpoint |
| Attacks detected by a regexp-based rule | Custom attack detector | The regexp-based rule that matched, which you can also partially disable |
| Virtual patch | Virtual patch | The virtual patch rule. Virtual patches work regardless of the filtration mode |
| Brute force, Forced browsing, Broken Object Level Authorization, Enumeration | Mitigation control or trigger | Open Mitigation control, or the trigger in Triggers. If the source was denylisted, the IP list entry |
| Blocked source | IP lists | The denylist entry for the source IP |
| Suspicious API activity, Account takeover, Security crawlers, Scraping, Unrestricted resource consumption (details) | API Abuse Prevention | View API Abuse profile to review the detection confidence and change the profile, or API Abuse exception list to exempt the source IP |
| Undefined endpoint, Undefined parameter, Invalid parameter, Missing parameter, Missing authentication, Invalid request (details) | API Specification Enforcement | Open Spec Enforcement Policy |
| GraphQL query size, GraphQL value size, GraphQL query depth, GraphQL aliases, GraphQL batching, GraphQL introspection, GraphQL debug (details) | GraphQL API Protection | The Detect GraphQL attacks rule |
| Credential stuffing | Credential Stuffing Detection | The Credential Stuffing configuration, specifically the monitored authentication endpoints |
Before adjusting, it is worth investigating the full context of the attack's requests: the session they belong to and the full sequence of requests in it. This shows all activity of the threat actor and what resources can be compromised.
False positives
A false positive occurs when attack signs are detected in a legitimate request.
To prevent the filtering node from recognizing such requests as attacks in future, you can mark all or specific requests of the attack as false positives. In the request details, use Mark as → FP; to mark several requests at once, select them in the request list first.
Marking a request as a false positive excludes it from the attack data. To also stop the node from detecting the same attack sign in similar requests, use FP rule, which creates a rule that skips the detection.
You can revert a mark with Mark as → FP on an already marked request.
Wallarm hides false positives from the attack list by default. To review them, filter the list by Verification Status.
See details on false positives here.
Full context of threat actor activities
Once the malicious request is detected by Wallarm and displayed in the Attacks section as the part of some attack, you can see the full context of this request: to which user session it belongs and what the full sequence of requests in this session is. This allows you to investigate all activity of the threat actor to understand attack vectors and what resources can be compromised.
To perform this analysis, open the attack, switch to the Requests tab, and select a request. In the request details, open the Session ID field menu and select Investigate this attack in API Sessions. Wallarm opens the API Sessions section filtered: the session that the initial request belongs to is displayed; only the initial request is displayed within this session.
Remove the filter by request ID to see all other requests in the session: now you have the full picture of what was going on within the session the malicious request belongs to.
Sharing an attack
To pass an attack to a colleague, use the share button in the attack details. Wallarm generates a link that opens the same attack with the same filter and time range applied, so the recipient sees exactly what you see.
Dashboards
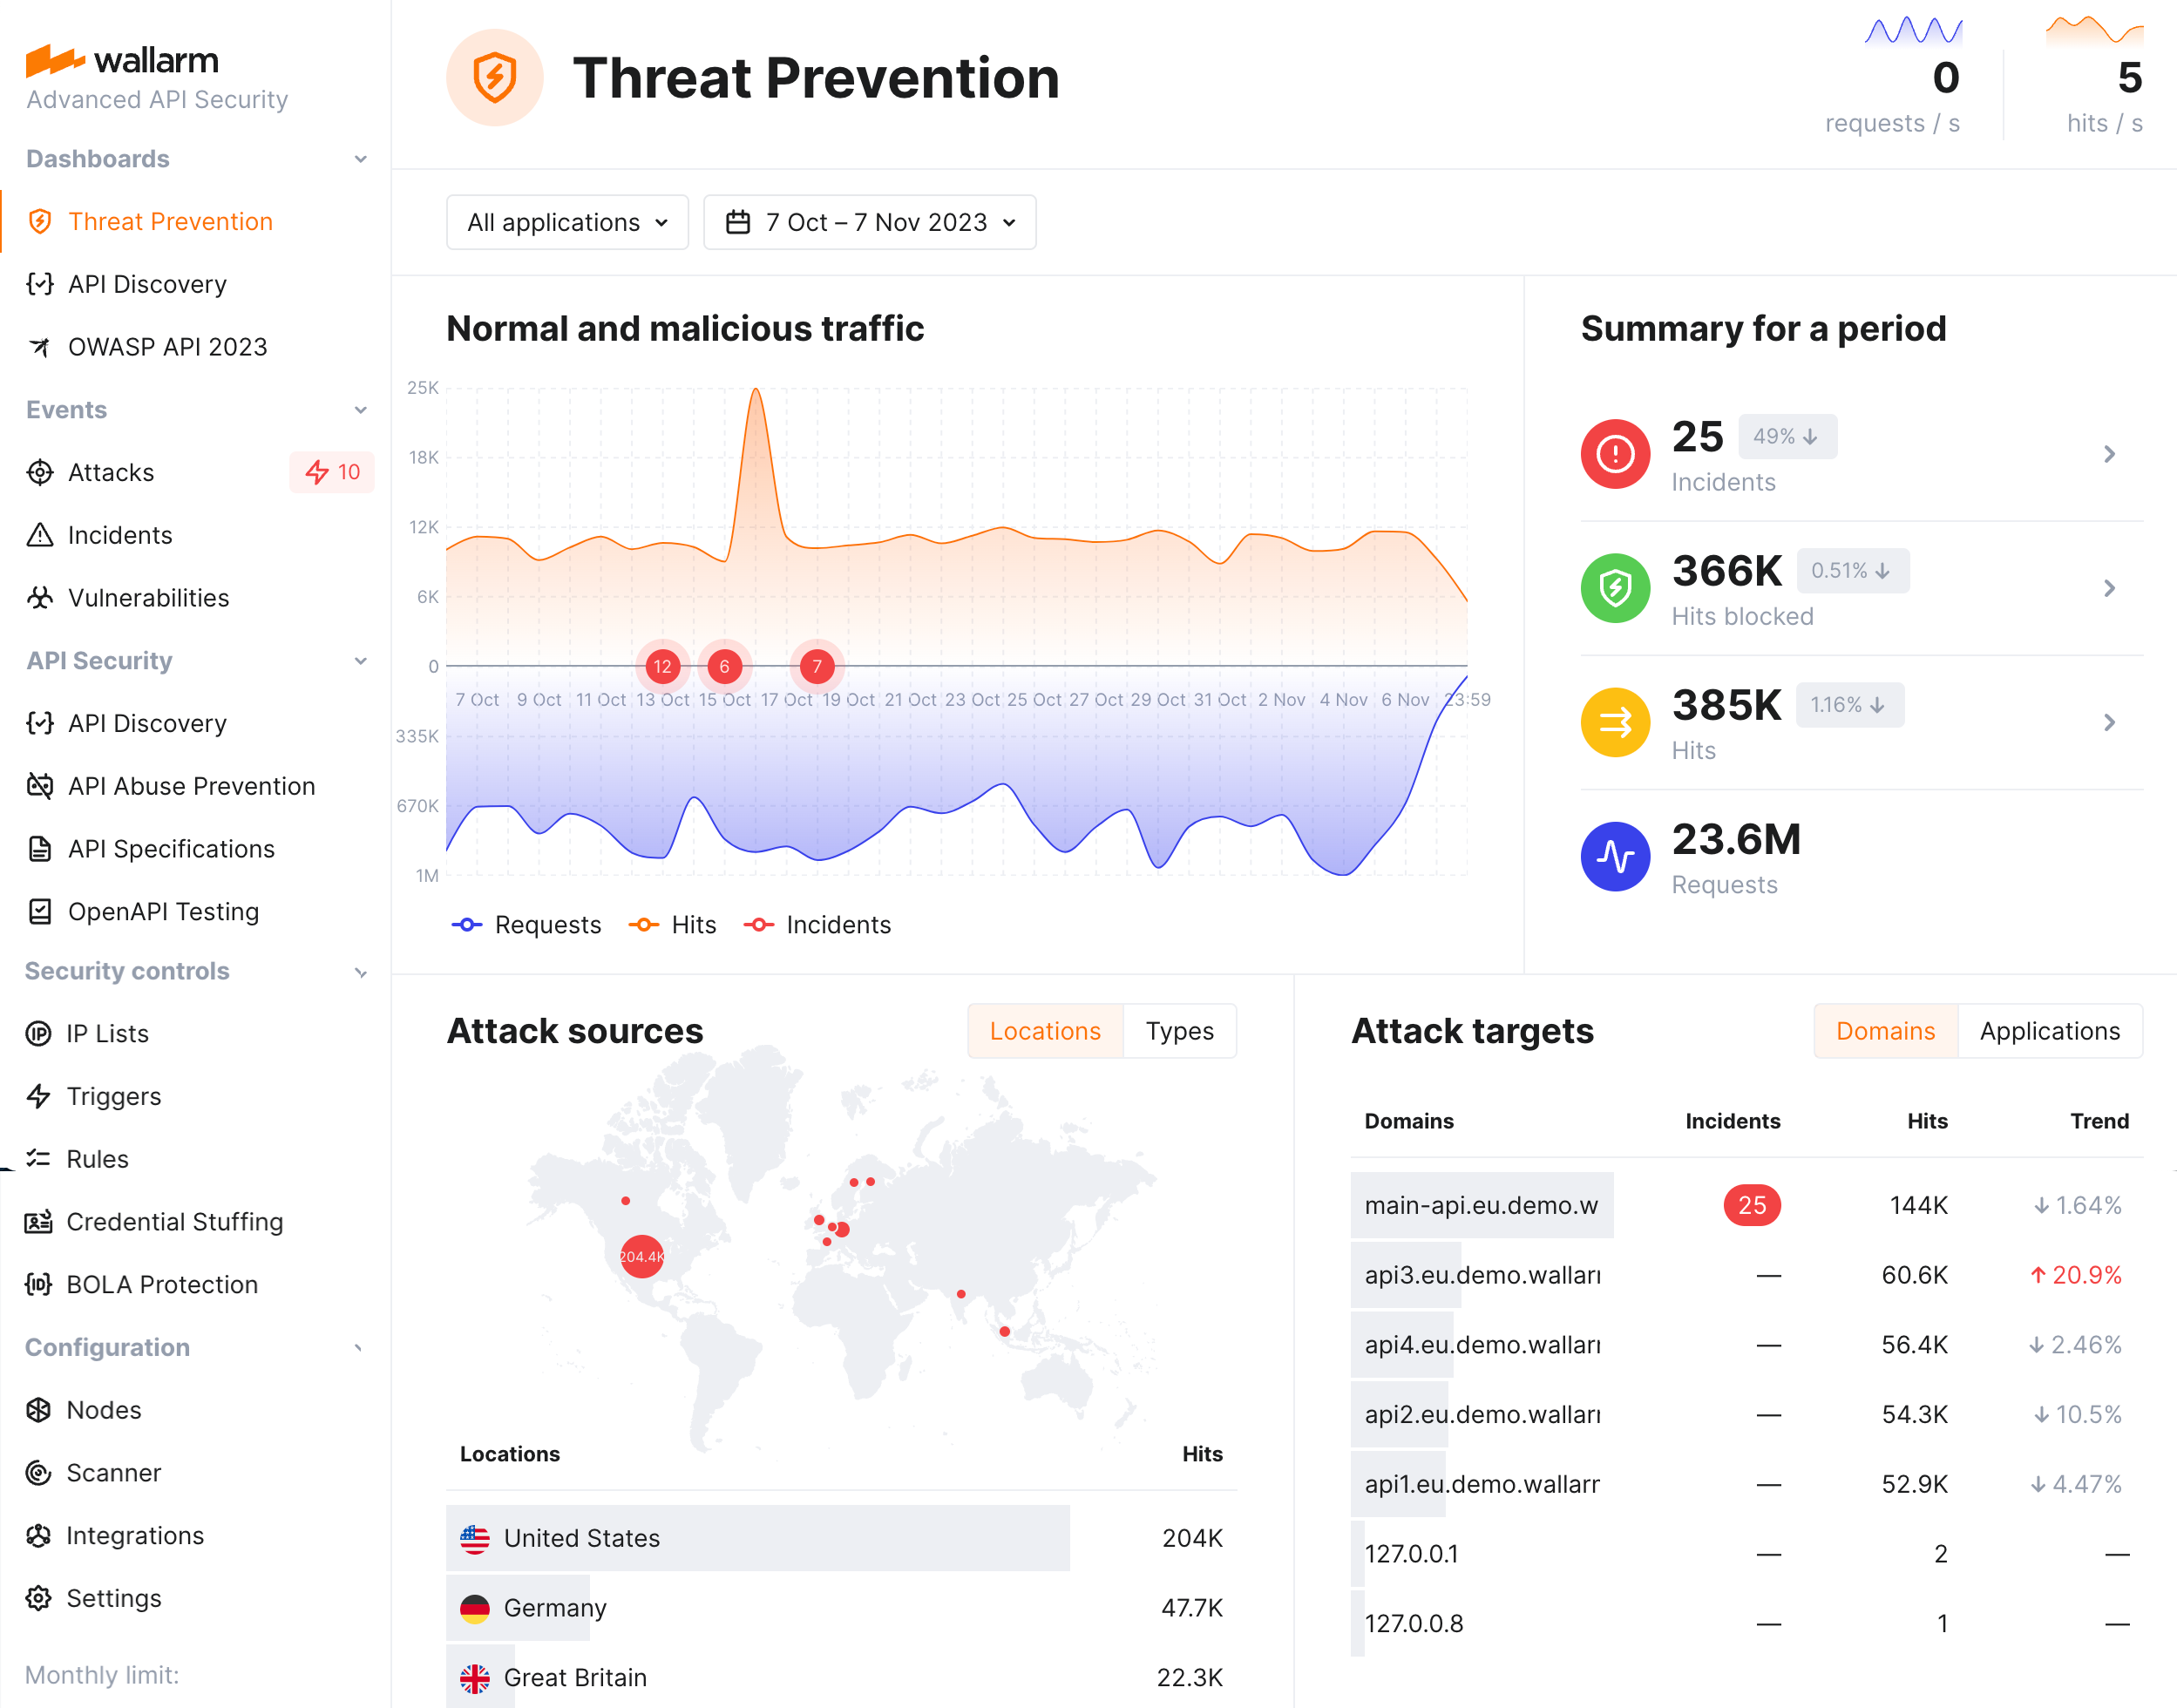
Wallarm provides comprehensive dashboards to help you analyze detected attacks.
Wallarm's Threat Prevention dashboard provides general metrics on your system's security posture, including multi-aspect information about attacks: their sources, targets, types and protocols.
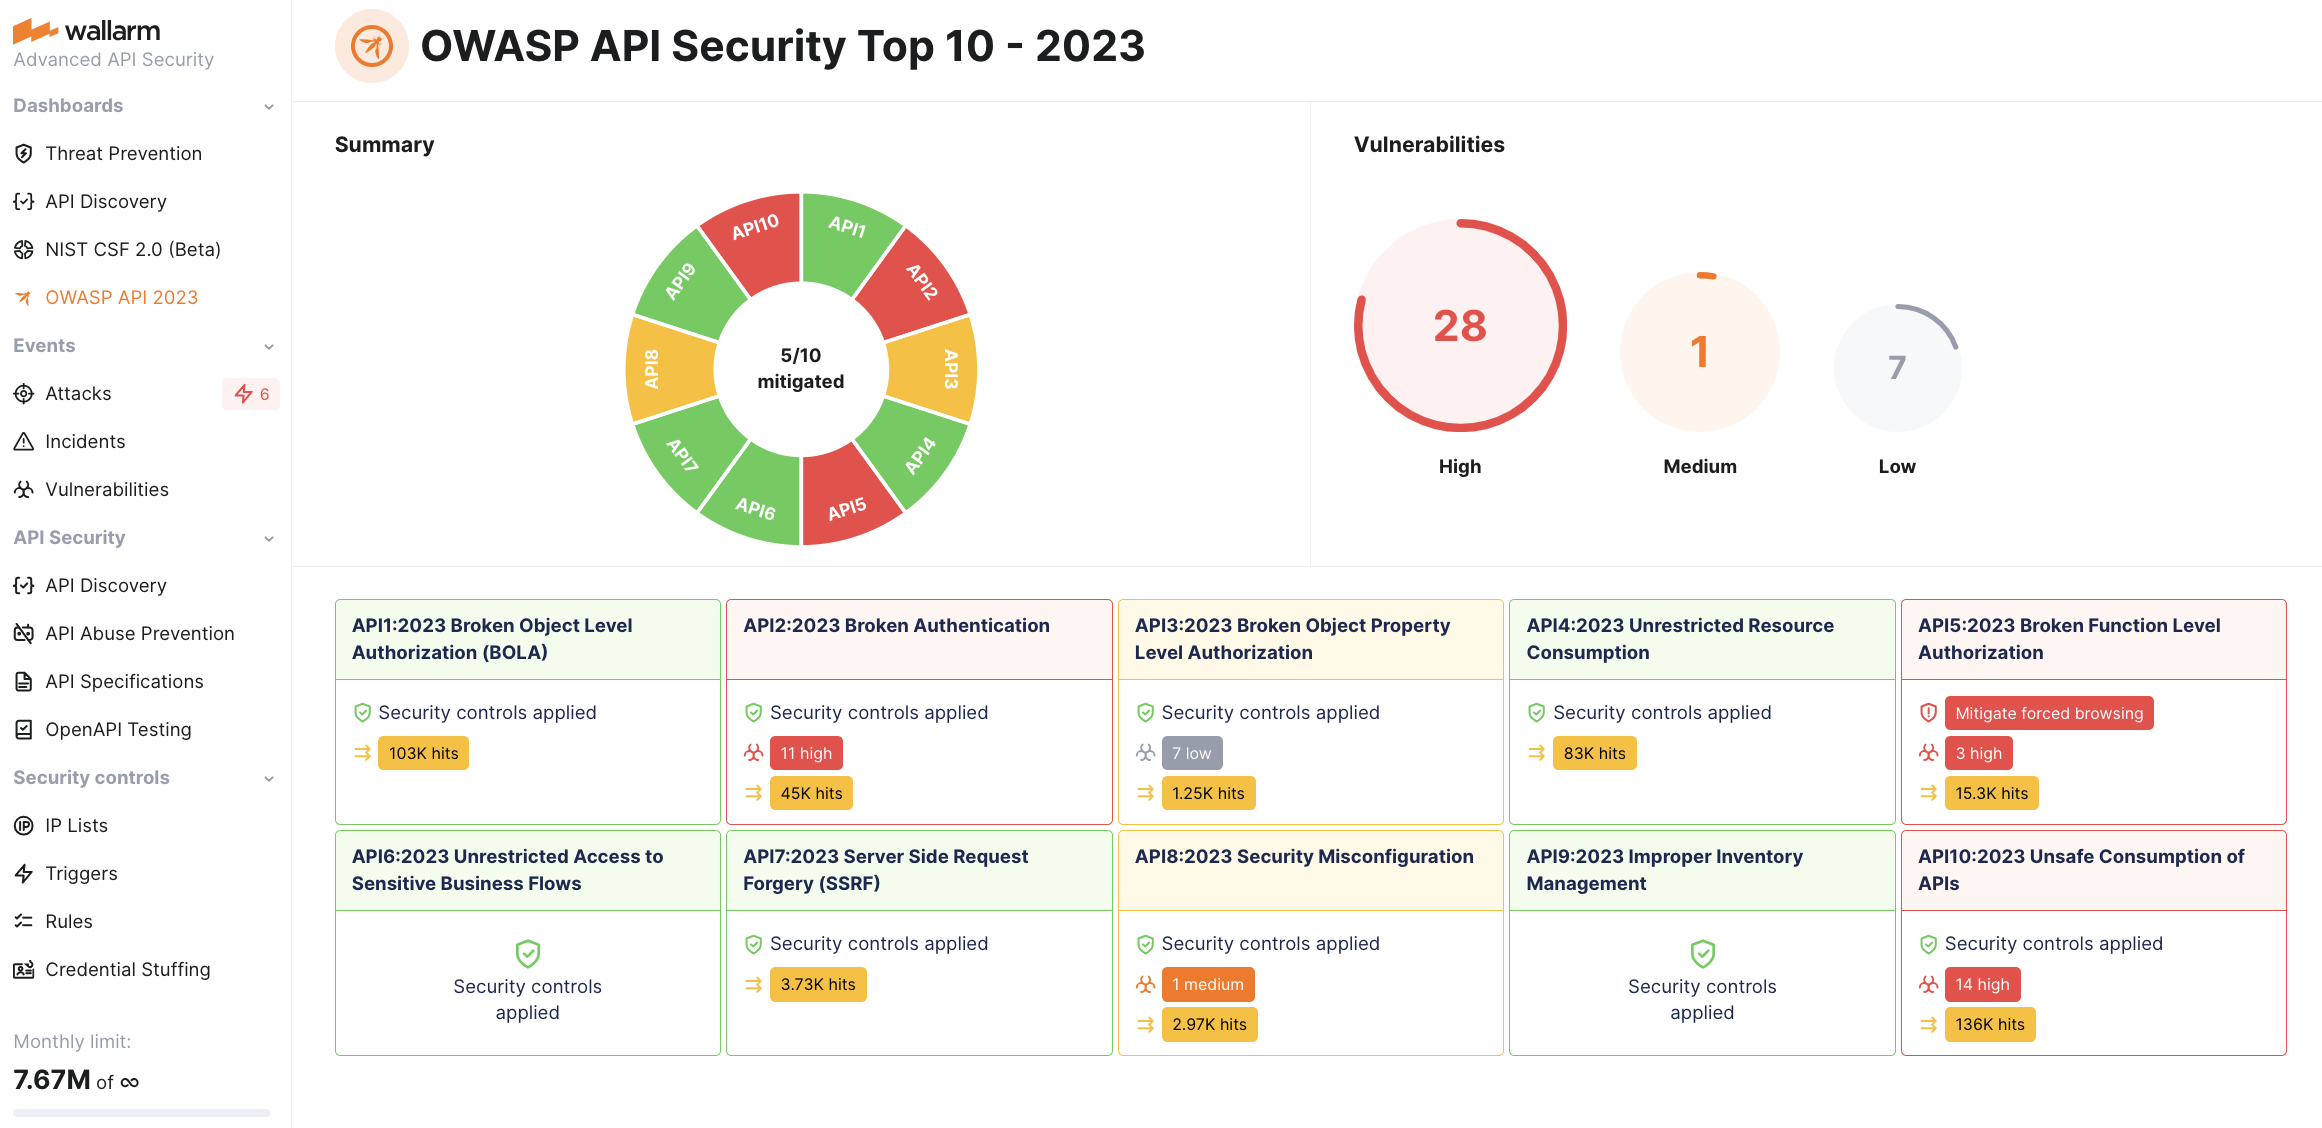
The OWASP API Security Top 10 dashboard provides detailed visibility into your system's security posture against the OWASP API Top 10 threats, including attack information.
Notifications
Wallarm can send you notifications on detected attacks, hits and malicious payloads. It allows you to be aware of attempts to attack your system and analyze detected malicious traffic promptly. Analyzing malicious traffic includes reporting false positives, allowlisting IPs originating legitimate requests and denylisting IPs of attack sources.
To configure notifications:
-
Configure native integrations with the systems to send notifications (e.g. PagerDuty, Opsgenie, Splunk, Slack, Telegram).
-
Set the conditions for sending notifications:
-
To get notifications on each detected hit, select the appropriate option in the integration settings.
See the example of the notification about detected hit in the JSON format
[ { "summary": "[Wallarm] New hit detected", "details": { "client_name": "TestCompany", "cloud": "EU", "notification_type": "new_hits", "hit": { "domain": "www.example.com", "heur_distance": 0.01111, "method": "POST", "parameter": "SOME_value", "path": "/news/some_path", "payloads": [ "say ni" ], "point": [ "post" ], "probability": 0.01, "remote_country": "PL", "remote_port": 0, "remote_addr4": "8.8.8.8", "remote_addr6": "", "tor": "none", "request_time": 1603834606, "create_time": 1603834608, "response_len": 14, "response_status": 200, "response_time": 5, "stamps": [ 1111 ], "regex": [], "stamps_hash": -22222, "regex_hash": -33333, "type": "sqli", "block_status": "monitored", "id": [ "hits_production_999_202010_v_1", "c2dd33831a13be0d_AC9" ], "object_type": "hit", "anomaly": 0 } } } ] -
To set the threshold of attack, hit or malicious payload number and get notifications when the threshold is exceeded, configure appropriate triggers.
-
API calls
To get the attack details, you can call the Wallarm API directly besides using the Wallarm Console UI. The Attacks section is backed by the Attacks API, which lets you run the same aggregation queries, drill into groups, compute widgets, mark verdicts, export results, and manage saved views from your own client.